Collecting, Mapping and Presenting Office Occupancy Rates
The Challenge
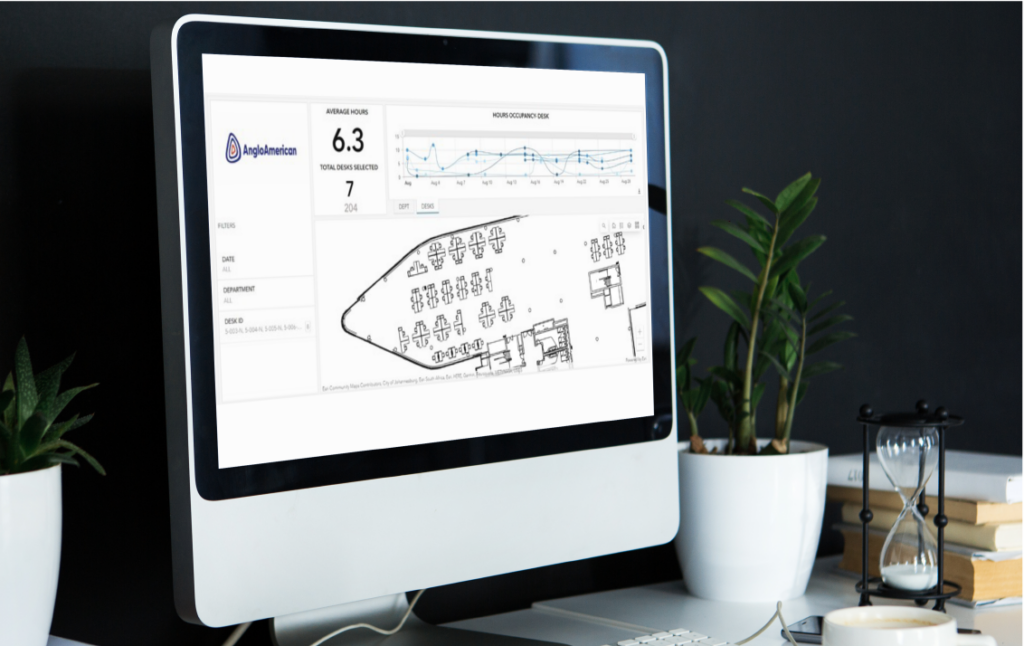
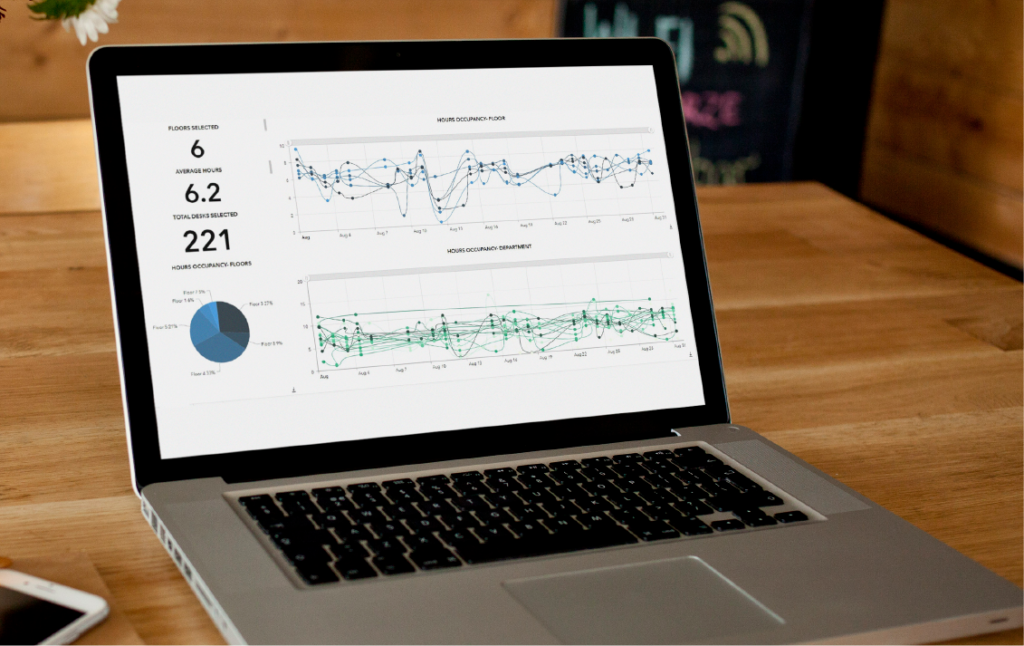
In the wake of the global shift towards remote and hybrid work arrangements due to the Covid-19 pandemic, a multinational corporation found itself in need of a strategic resolution to accurately gauge and visualize the occupancy rate of their Sandton office. In alignment with the organization’s internal guidelines that stipulated a hybrid working model for departments comprising 60% on-site desk utilization and 40% remote work engagement. Individual desk occupancy rates were unknown, but hourly desk port usage was being captured by their ICT department, creating a wealth of data to draw insights from.